
Colorado’s Public Workforce System
The public workforce system provides free services to assist employers and job seekers across Colorado.
Colorado’s network of locally-run workforce centers assists thousands of employees and job seekers across the state each year

Value Add of the Public Workforce System
Colorado’s Public Workforce Economic Impact More than $317 million in economic strength!
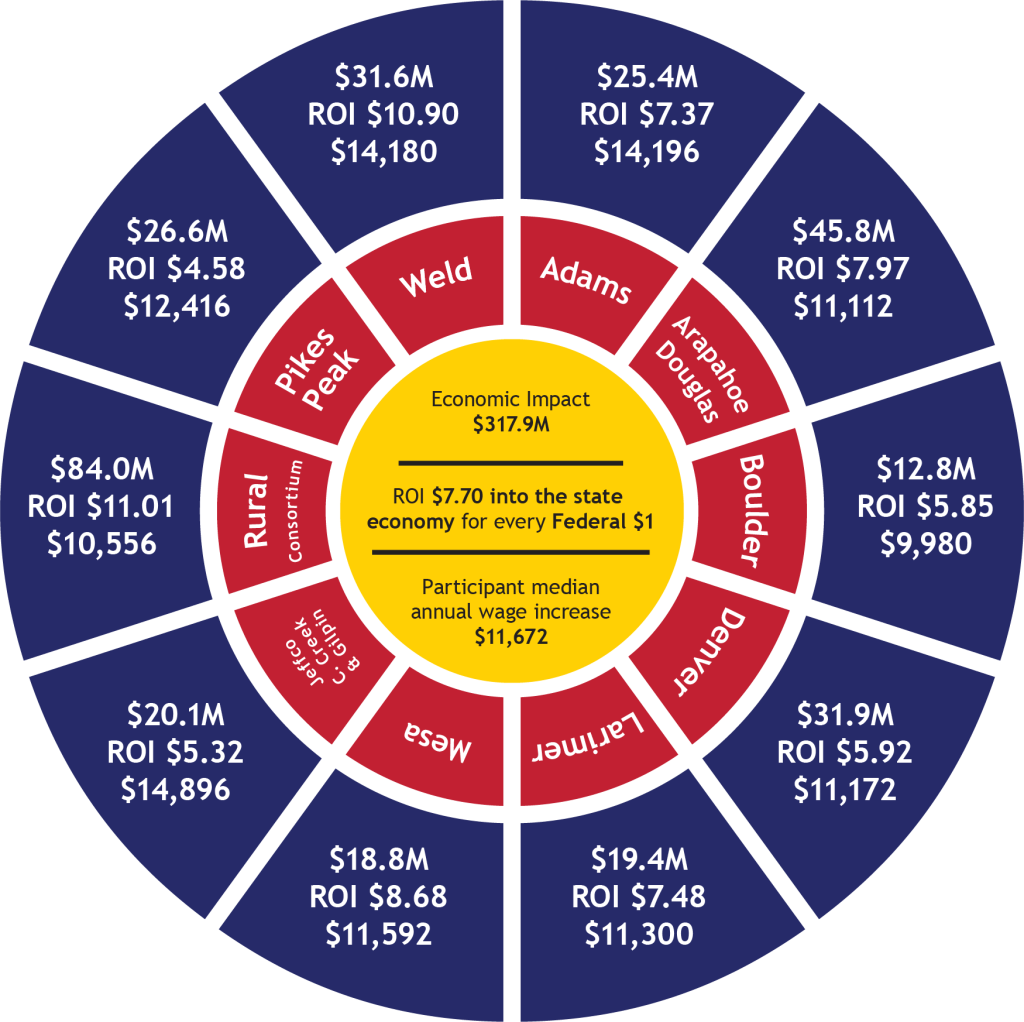
Source: Colorado Department of Labor and Employment

Additional Resources:
- View the PY2023 WIOA Annual Report for additional program outcomes and workforce ROI data.
- Access past WIOA Annual Reports to see what the Colorado public workforce system has accomplished since 2010.
